



In case you missed it see what’s in this section
Let's Talk
Your Total Guide To business

Claude Opus 5.5 Benchmarks: Rank 1, and the 53 Rows Behind It
Claude Opus 5.5 benchmarks put it first on an independent aggregate with a score of 86.39 — rank 1 of 655 tracked models — and the reason that rank is worth more than the number is the record underneath it: 53 of 73 rows, all 8 of 8 categories, 53 verified and zero provisional, read 2026-10-07. Claude Opus 5.5 is carried here at list rate with no markup, so re-running any of these evaluations against the live model is a model-string change.
A rank without its coverage count is a number you cannot act on. The headline is the rank; the story is how much of the board it was earned on, and how much of the board the models beside it were measured on.
The rank, and the shape of the record behind it
Four models, one aggregate, and the counts differ more than the scores do. All figures read 2026-10-07.
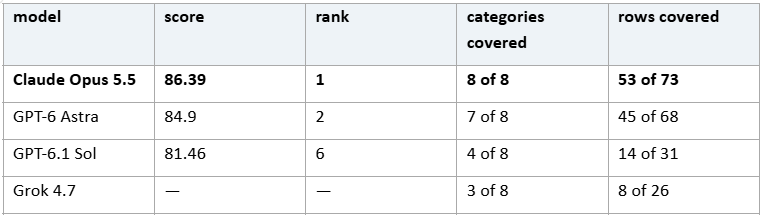
Read the first column and the last column together, because they are not measuring the same thing. The score answers "how well did this model do where it was tested". The row count answers "how much of the model was tested", and a model in the top four on a quarter of the board is a different claim from a model in first place on most of it.
The distinction is what makes the last row the most informative one in the table. Grok 4.7 has no score and no rank at all on this board — the evaluator marks it ineligible for the ranking and publishes only the 8 rows it holds across 3 categories. That is not a verdict that the model is weak. It is a statement that the evidence is not there yet, and the honest reading of an empty score slot is "unknown", not "bad".
Why the coverage counts carry more weight than the score
Three details in that record do the work, and all three are the kind of thing a benchmark table usually omits.
53 verified against 0 provisional. The evaluator distinguishes rows it has verified from rows it has not. Opus 5.5's record is entirely in the first bucket. A score assembled partly from provisional rows is a score with an asterisk, and this one does not have it.
8 of 8 categories, against 4 of 8 for GPT-6.1 Sol. Sol's 81.46 is real and it is built from half the categories — the evaluator has no multimodal row for it at all. A model that is strong on reasoning and code and unmeasured on multimodal work should not be compared, category for category, with one that has all eight. The overall score compresses that difference away.
45 of 68 for GPT-6 Astra, against 53 of 73 for Opus 5.5. Both are broad records and they are close in size — which is worth noting, because it means the 1.49-point gap between rank 1 and rank 2 is a gap between two well-covered models rather than an artifact of one of them being tested less.
Put together, those three points are the argument for the rank. The score says first place; the coverage says the first place was measured on nearly the whole board, with everything verified, across every category the board has.
What the category grid actually shows
Zoom in one level and the picture stops being uniform, which is the useful part.
Opus 5.5's strongest published rows, read 2026-10-07: SWE-bench Pro 89.9%, ARC-AGI-2 91.7%, Toolathlon-Verified 77.8%, OfficeQA Pro 67.7%, Terminal-Bench 4.0 66.40%, and Gray Swan IPI 1.0% — the last one being a prompt-injection resistance measure where a lower number is better, and 1.0% is the best of the four models here, against 8.5% for GPT-6 Astra.
Now the row that does not cooperate. OSWorld 2.0: 48.7% for Opus 5.5 against 72.6% for GPT-6 Astra. On computer-use and desktop-agent tasks, the model in second place is not second at all — it is far ahead, and it is ahead by a margin bigger than most of the wins in the other direction.
That is what an aggregate is for and what it hides. A model ranked first overall can be well behind on a specific capability, and if that capability is your product, the overall rank is the wrong row to have read. The category grid is where a benchmark stops being a score and starts being a decision.
The second board agrees, and diverges once
A single aggregate is one instrument. The independent intelligence index is a second one, and it lands in the same place.
At the same read date, Opus 5.5 records 57.62 on the intelligence index — the highest of the ten models in that pull — with the OpenAI subjects of this series at 51.83 and 52.67 and Grok 4.7 at 46.45. Its category readings follow: HLE 0.6135, SciCode 0.6690, MMMU-Pro 0.8769, long-context retrieval 0.8467, Terminal-Bench 4.0 0.5960, GDPval 1866.24 — each of those the top of the four. All read 2026-10-07, and all taken at Max effort, recorded as `Max, Default Fallback`.
There is one place the two boards disagree in a way worth naming, and it points at the same model.
Hallucination rate: 0.5861 for Opus 5.5, against 0.5427 for GPT-6.1 Sol, 0.5134 for GPT-6 Astra and 0.2934 for Grok 4.7. Lower is better. The model ranked first on the intelligence index has the highest fabrication rate in this set of four, and Grok 4.7 — the model with no score at all on the other board — has the lowest.
Two things follow. A first-place aggregate is not a first-place on every axis, and the axis it loses here is the one that matters most to anyone shipping output to a customer without a review step. And the model with the thinnest benchmark record is the one with the cleanest reading on the metric that the thick record does not measure.
Neither of those is a contradiction; both are the reason a benchmark table belongs in a decision alongside the coverage counts and the read date, not in place of them.
Four checks before you quote a Claude Opus 5.5 benchmark
Four checks, in the order they change the conclusion.
Quote the coverage count next to the score. "Rank 1" and "first, on 53 of 73 rows and all 8 categories, verified" are the same fact with and without the part that makes it usable.
Check whether the model you are comparing against was measured at all on that axis. GPT-6.1 Sol has no multimodal row; Grok 4.7 has no score and no rank. Comparing a full record to a partial one flatters whichever one you prefer.
Attach the effort setting. These readings were taken at Max, recorded as `Max, Default Fallback`. A cross-model benchmark table without settings is a table of configurations rather than of models.
Find the row you actually depend on before you accept the aggregate. Opus 5.5 leads most of this board and trails GPT-6 Astra by 23.9 points on OSWorld 2.0's computer-use tasks. If that is your workload, the overall rank told you nothing.
The takeaway
Claude Opus 5.5 ranks first on an independent aggregate at 86.39, and the record behind that rank is the more useful fact: 53 of 73 rows, 8 of 8 categories, 53 verified, 0 provisional, out of 655 tracked models, read 2026-10-07.
The second-place model sits 1.49 points back on a comparably broad record; the fourth has no score and no rank at all, on 8 rows across 3 categories.
The evidence is why the rank holds and the categories are why it is not the end of the analysis. The same board that puts Opus 5.5 first has it 23.9 points behind GPT-6 Astra on computer-use tasks, and the second board — where it also leads at 57.62, read the same day, at Max effort — has it last of the four on hallucination rate. A benchmark tells you where to look. Your own task tells you what you found.
OrcaRouter carries Claude Opus 5.5 at list rate on the same key as the rest of the Anthropic line, so re-running the one evaluation your workload depends on is a model-string change rather than a second integration











Weather in Bath
Listings